

Report · Your district or school
A chronic absenteeism report for your district or school.
Choose any public school or district in California. The report charts its chronic absenteeism from 2017-18 to 2025-26, sets it beside others like it, and gives your team questions to work through together.
- Chronically absent, 2025-26
- Highest year
- Before the pandemic
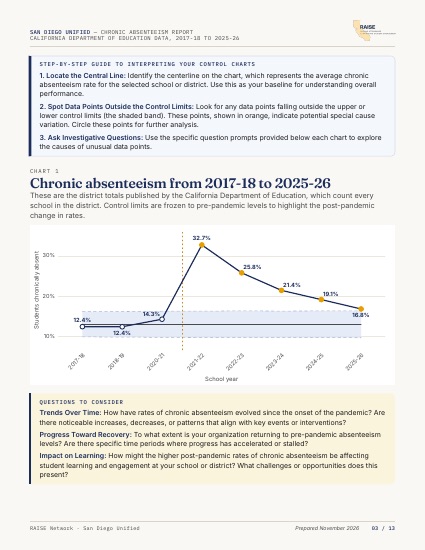
Chronic absenteeism is the share of students who miss 10% or more of the days they are enrolled. Source: California Department of Education, 2017-18 to 2025-26. California did not publish figures for 2019-20.
What's in the report
PDF · 8 pages for a school, 13 for a district
-
01 · Your trend
Every year since 2017-18, on a control chart
Control limits are set from the years before the pandemic, so you can see which changes since then are real and which are ordinary year-to-year variation.
-
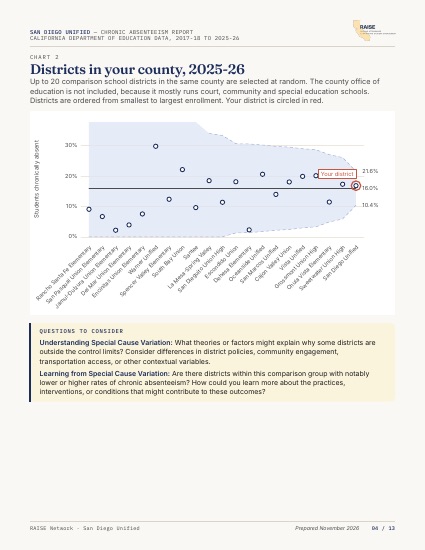
02 · Others like you
A like-with-like comparison
A school is set beside schools of its own type in its county, with the same grade levels and a similar share of low-income students. A district is set beside the other districts in its county. Continuation and alternative schools are never compared with traditional schools.
-
03 · Inside your district
Every school, by type and level
A funnel chart shows which schools sit outside what their size would predict: the places to learn from, and the places that may need support.
-
04 · Student groups
Who is missing the most school
Rates for each student group the state reports, with questions to take to students, families and staff.
New to control charts? Read a short guide ↗. The second page of every report explains how to read them.
Go further
This report uses yearly data. RAISE districts see new data every two weeks.
California publishes chronic absenteeism once a year, after the school year has ended. Districts in the RAISE Network share attendance data every two weeks and see control charts like these on a live dashboard and in a report each quarter, while there is still time to act. If that would be useful to you, tell us a little about your school or district and we will be in touch.
More free tools
Foundational Change Package
Four foundational practices that RAISE districts implement together: District Focus, Warm Communication, First Faces and Data-Informed Outreach.
Control Chart Dashboard
Explore chronic absenteeism patterns for any school or district in California and find bright spots to learn from.
Attendance & Funding Calculator
Estimate how changes in attendance affect LCFF funding, with current California rates.